


NiceNIC recorded 28,713 abuse-related complaints involving 11,414 domains in the October 2026 reporting dataset, covering both generic top-level domains (gTLDs) and country-code top-level domains (ccTLDs). Phishing accounted for 61.10% of recorded complaints.
The dashboard reported 6,433 paused domains and 175 recovered domains associated with these complaint records, alongside an average response time of 2.5 days.
This report examines complaint categories, recorded domain restrictions, and recovery statistics for complaints created between October 1 and October 31, 2026. NiceNIC's Domain Abuse Transparency resources provide further information about reporting, investigation, and review procedures.
Reporting Scope and Methodology
The report uses the following dashboard filters:
The date range selects complaints by their creation date in the system. Pause and recovery figures are associated with those selected records and reflect the dashboard snapshot. They should not be interpreted as counts of operations performed exclusively during October.
Complaint totals and domain totals measure different things. A domain may be associated with multiple complaints, and a recorded complaint does not by itself establish that abuse occurred.
The categories include DNS Abuse-related reports and other domain-related complaints. Unless a section explicitly specifies gTLDs, the October figures cover both gTLDs and ccTLDs.
October Overview
The pause rate is calculated as paused domains divided by domains involved. The recovery rate is calculated as recovered domains divided by paused domains.
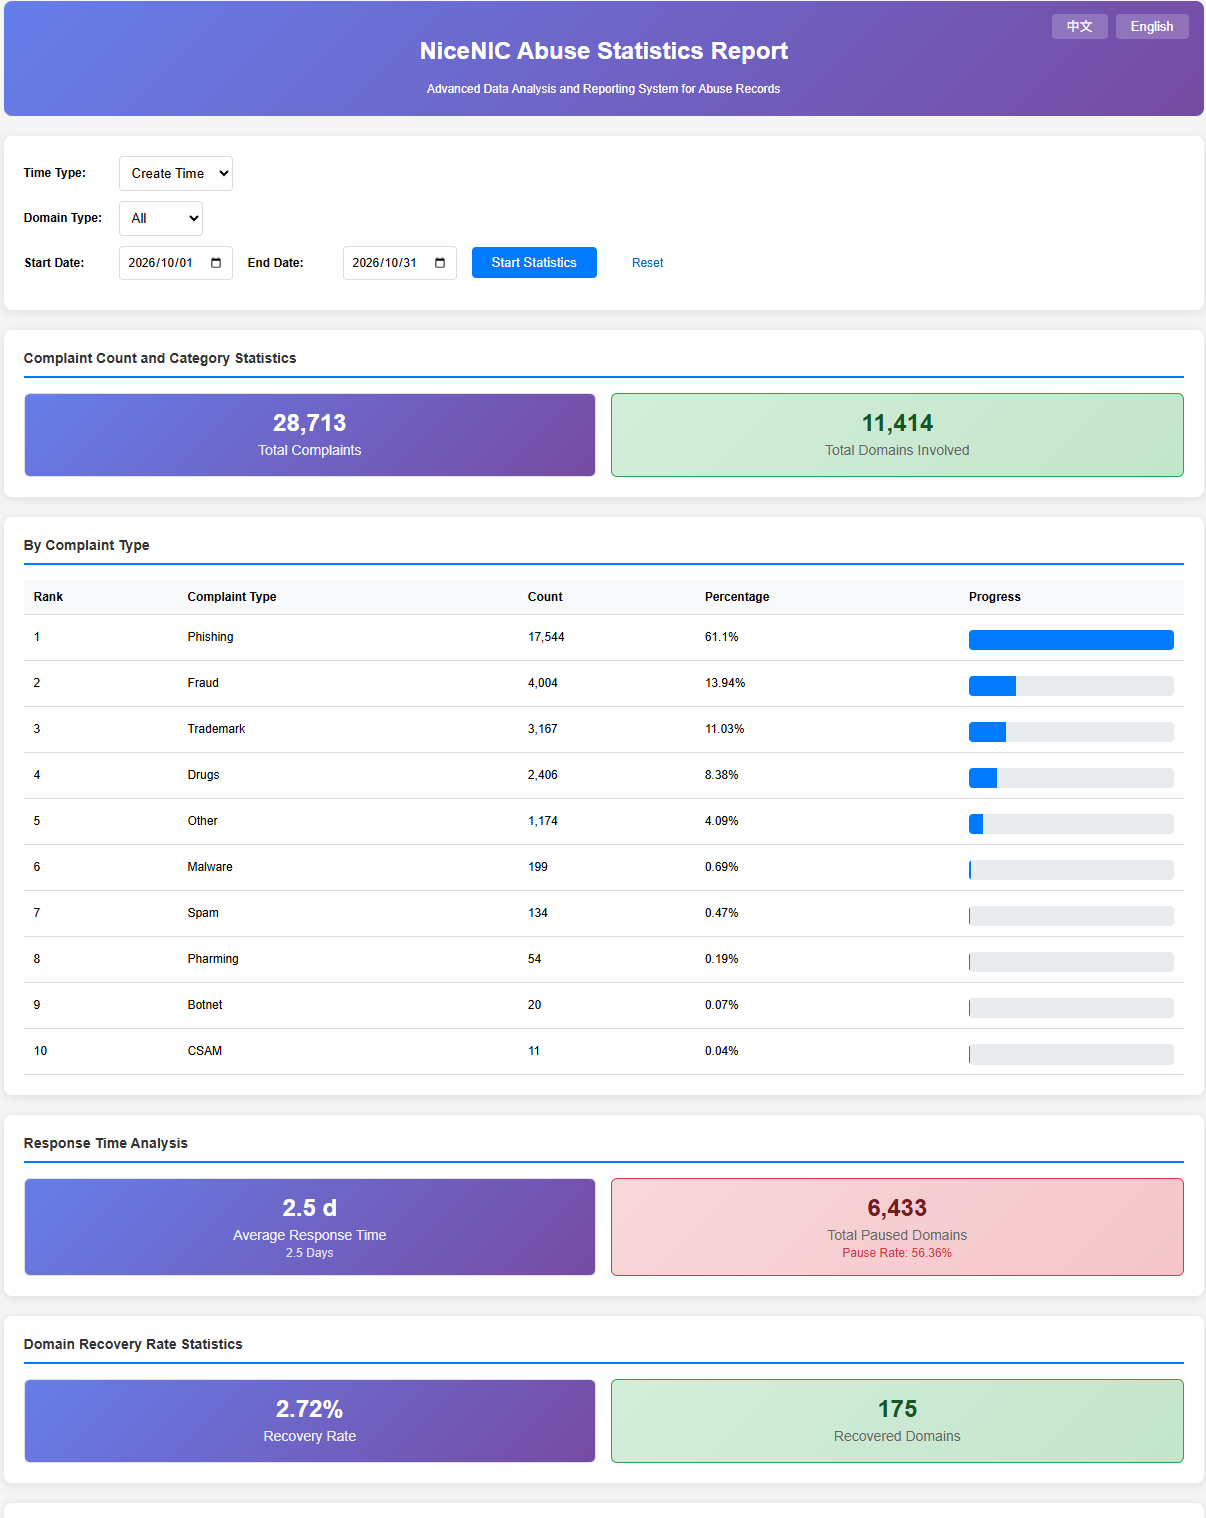
Image caption: October 2026 abuse statistics covering gTLDs and ccTLDs, selected by complaint creation date.
Complaint Categories
The October complaint distribution across all domain types was:
Percentages represent each category’s share of recorded complaints, rounded to two decimal places.
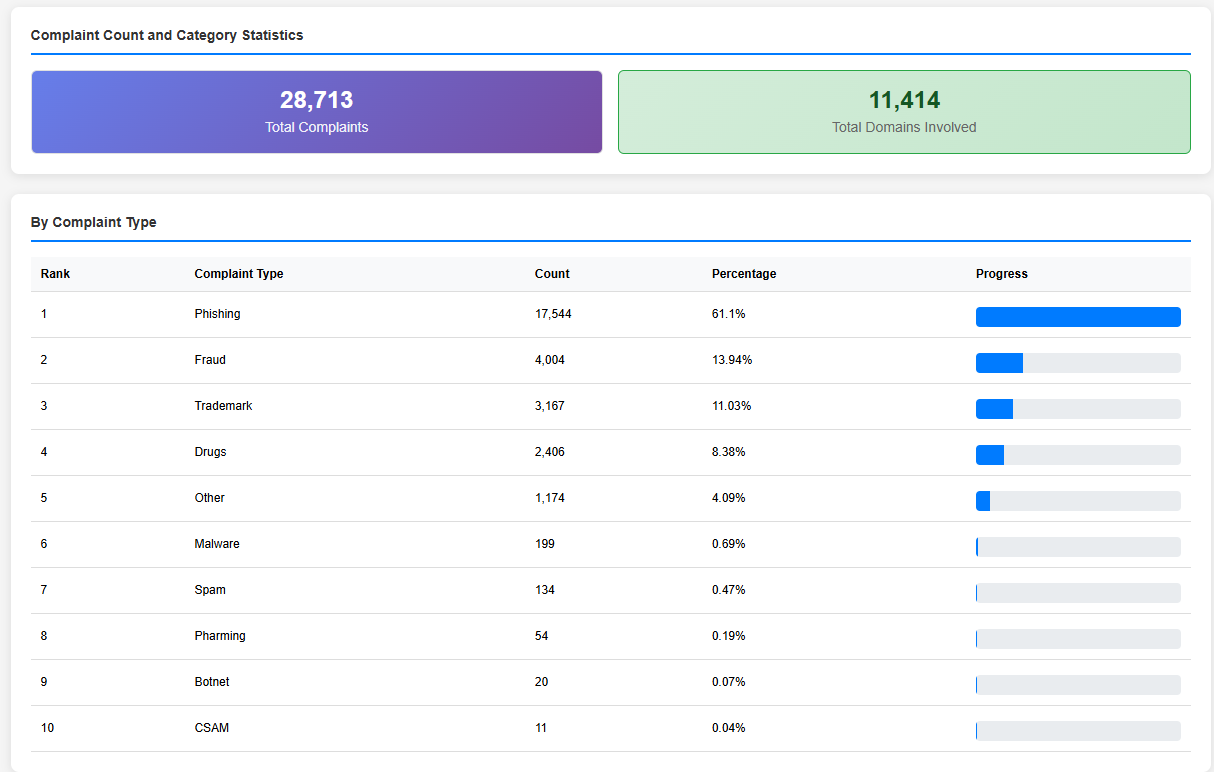
Image caption: October 2026 complaint distribution across gTLDs and ccTLDs. Counts represent complaint records, rather than confirmed incidents or unique abusive domains.
Phishing represented approximately three in five complaints. Fraud and trademark reports were the next largest categories, followed by drug-related complaints.
These figures describe the composition of the reporting workload. They do not establish how many allegations were substantiated or how many distinct domains were associated with each category.
Lower-volume categories remain relevant to case handling. A category’s percentage does not determine the severity or urgency of an individual report.
September Comparison: gTLDs Only
The September 2026 Abuse Report used gTLD statistics. The comparison below therefore uses gTLD data for both months, selected by complaint creation date.
October’s gTLD dataset contained 1,057 fewer complaints and 1,117 more paused domains. Malware reports declined from 260 to 136, while pharming reports fell from 102 to 29.
Other indicators moved upward. Phishing reports increased from 15,558 to 16,801, fraud reports rose from 2,572 to 3,334, and more domains appeared in the dataset.
These comparisons describe the reported monthly snapshots. Follow-up time and case status may affect pause and recovery figures. The results alone do not establish a reduction in underlying abuse or faster handling.
Domain Pauses and Recovery
For the combined October dataset, the dashboard reported 6,433 paused domains, equivalent to 56.36% of the 11,414 domains involved.
This percentage measures recorded pauses within the selected dataset. It does not measure the proportion of complaints confirmed, the share of cases resolved, or the overall effectiveness of abuse mitigation.
The dashboard does not provide a complete outcome breakdown for domains outside the paused count. Those domains should not automatically be classified as unhandled cases or confirmed abuse left active.
The dashboard also reported 175 recovered domains, producing a recovery rate of 2.72%. Recovery may follow remediation, clarification, or further review. Recovery alone does not establish that an earlier restriction was mistaken, and a lower recovery rate is not inherently a better outcome.
Response Time
The reported average response time for the combined October dataset was 2.5 days.
This aggregate figure does not show the distribution of response times, separate results for individual complaint categories, or the time required to complete every case. It should not be presented as a guaranteed response deadline or a measure of time to resolution.
Category-specific timing and case records would be needed to assess handling speed for particular threats or performance against a specific service target.
Handling Reports Across gTLDs and ccTLDs
The complaint categories in this report extend beyond the contractual definition of DNS Abuse. ICANN's DNS Abuse resources describe malware, botnets, phishing, pharming, and spam when used to deliver those forms of abuse.
Under NiceNIC's Abuse Reporting & Handling Policy, investigations consider the report, reasonably available information, and applicable requirements. Actionable evidence of DNS Abuse involving a sponsored gTLD requires prompt mitigation to stop or disrupt the abuse.
Handling of ccTLD reports takes account of the relevant registry’s requirements, applicable law, registration terms, and NiceNIC policy. Requirements can vary by extension.
Fraud, unlawful goods, intellectual-property disputes, and other complaints may require different handling paths. Classification outside the contractual DNS Abuse definition does not exclude action where another applicable requirement or policy supports it.
Reporting Suspected Abuse
Suspected abuse involving a NiceNIC-sponsored domain can be submitted through the official Report Domain Abuse channel.
Include the affected domain, relevant URLs, a factual description, and the date and time observed. Depending on the complaint, useful supporting information may include email headers, technical logs, transaction details, or rights documentation. Avoid sending passwords, authentication codes, or unrelated personal information.
For suspected child sexual abuse material, provide the domain, relevant URLs, and a brief factual description. Do not download, save, screenshot, share, or upload the suspected material.
Customers seeking review of a restriction should follow the instructions in the abuse notification and provide relevant clarification or remediation evidence.
Data Notes
The figures reflect the dashboard snapshots used for this report. Case status can change after a snapshot as investigations, remediation, and review continue.
Complaint percentages describe the reporting mix. They do not measure abuse prevalence across NiceNIC’s entire domain portfolio.
October’s all-domain totals include ccTLDs and should not be directly compared with September’s gTLD-only totals. The separate comparison above uses gTLD data for both months.
This report presents aggregate statistics without identifying individual registrants or disclosing individual case details.
Primary Sources
- NiceNIC Abuse Statistics Report: October 2026 dashboard snapshots using Create Time with All and gTLD filters.
- NiceNIC September 2026 Abuse Report
- NiceNIC Domain Abuse Transparency
- NiceNIC Abuse Reporting & Handling Policy
- NiceNIC Report Domain Abuse
- ICANN DNS Abuse Resources


